Mapping potential conflicts between global agriculture and terrestrial conservation
| dc.contributor.author | Hoang, Nguyen Tien | |
| dc.contributor.author | Taherzadeh, Oliver | |
| dc.contributor.author | Ohashi, Haruka | |
| dc.contributor.author | Yonekura, Yusuke | |
| dc.contributor.author | Nishijima, Shota | |
| dc.contributor.author | Yamabe, Masaki | |
| dc.contributor.author | Matsui, Testuya | |
| dc.contributor.author | Matsuda, Hiroyuki | |
| dc.contributor.author | Moran, Daniel Dean | |
| dc.contributor.author | Kanemoto, Keiichiro | |
| dc.date.accessioned | 2023-06-07T10:46:24Z | |
| dc.date.available | 2023-06-07T10:46:24Z | |
| dc.date.created | 2023-05-31T15:15:59Z | |
| dc.date.issued | 2023 | |
| dc.identifier.citation | PNAS. 120, e220837612. | en_US |
| dc.identifier.issn | 0027-8424 | |
| dc.identifier.uri | https://hdl.handle.net/11250/3070332 | |
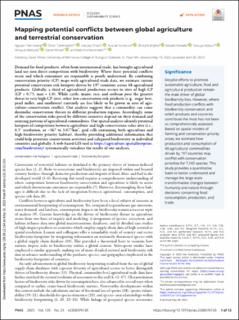
| dc.description.abstract | Demand for food products, often from international trade, has brought agricultural land use into direct competition with biodiversity. Where these potential conflicts occur and which consumers are responsible is poorly understood. By combining conservation priority (CP) maps with agricultural trade data, we estimate current potential conservation risk hotspots driven by 197 countries across 48 agricultural products. Globally, a third of agricultural production occurs in sites of high CP (CP > 0.75, max = 1.0). While cattle, maize, rice, and soybean pose the greatest threat to very high-CP sites, other low-conservation risk products (e.g., sugar beet, pearl millet, and sunflower) currently are less likely to be grown in sites of agri-culture–conservation conflict. Our analysis suggests that a commodity can cause dissimilar conservation threats in different production regions. Accordingly, some of the conservation risks posed by different countries depend on their demand and sourcing patterns of agricultural commodities. Our spatial analyses identify potential hotspots of competition between agriculture and high-conservation value sites (i.e., 0.5° resolution, or ~367 to 3,077km2, grid cells containing both agriculture and high-biodiversity priority habitat), thereby providing additional information that could help prioritize conservation activities and safeguard biodiversity in individual countries and globally. A web-based GIS tool at https://agriculture.spatialfootprint.com/biodiversity/ systematically visualizes the results of our analyses. | en_US |
| dc.language.iso | eng | en_US |
| dc.rights | Attribution-NonCommercial-NoDerivatives 4.0 Internasjonal | * |
| dc.rights.uri | http://creativecommons.org/licenses/by-nc-nd/4.0/deed.no | * |
| dc.title | Mapping potential conflicts between global agriculture and terrestrial conservation | en_US |
| dc.title.alternative | Mapping potential conflicts between global agriculture and terrestrial conservation | en_US |
| dc.type | Peer reviewed | en_US |
| dc.type | Journal article | en_US |
| dc.description.version | publishedVersion | en_US |
| dc.rights.holder | 2023 the Author(s). Published by PNAS. | en_US |
| dc.source.volume | 120 | en_US |
| dc.source.journal | Proceedings of the National Academy of Sciences of the United States of America | en_US |
| dc.source.issue | 23 | en_US |
| dc.identifier.doi | 10.1073/pnas.2208376120 | |
| dc.identifier.cristin | 2150515 | |
| dc.source.articlenumber | e220837612 | en_US |
| cristin.ispublished | true | |
| cristin.fulltext | original | |
| cristin.qualitycode | 2 |
Tilhørende fil(er)
Denne innførselen finnes i følgende samling(er)
-
Publikasjoner fra Cristin - NILU [1343]
-
Vitenskapelige publikasjoner [1082]
Vitenskapelige artikler, kapitler og monografier.

Med mindre annet er angitt, så er denne innførselen lisensiert som Attribution-NonCommercial-NoDerivatives 4.0 Internasjonal